Workforce Metrics Using Child Welfare Data
Workforce metrics that can be constructed from child welfare data fall into three categories: caseload/workload, case continuity, and worker- and unit-level variability.
Caseload/Workload Metrics
Caseload metrics can help to
- Assess compliance with caseload standards (e.g., policy, statute)
- Describe and inform case assignment decisions
- Describe and address the work burden experienced by staff
- Describe and address inequities in caseloads among workers
- Inform workforce planning or staffing decisions
- Monitor caseloads to assess policy or practices intended to affect caseloads
Caseload metrics are among the most commonly used workforce metrics that can typically be obtained from child welfare data. These metrics are usually calculated as caseload per worker as of a specific date. Generally, there are two basic options for obtaining these metrics:
Option One – Average Aggregate Estimates1
Example: Total number of active children in care divided by the number of workers serving them
Advantages: Relatively easy to compute from basic reports
Disadvantages: Can’t be segmented, may produce underestimates if workers are assigned more than one case type
Option Two – Average Estimates per Assigned Worker2
Example: Number of children currently assigned to a worker summed across all assigned workers divided by the total of assigned workers
Advantages: Can be segmented, accounts for all cases a worker carries, produces a distribution, can be used with workload estimates for weighted caseload analysis
Disadvantages: Must be assembled from case-level data where case assignment information regarding worker and worker position data can be attributed to specific time periods (days, months, quarters, etc.)
Case Continuity Metrics
Measures of continuity address the degree to which cases receive attention from the same worker over time. The concept related to outcomes is that greater continuity of involvement of the same workers over time may lead to outcome improvements due to greater levels of family engagement, reduced loss of information, and fewer disruptions of planning and other processes.
Case continuity metrics can help to
- Identify where (regions, offices, supervisory units) there might be concerns about the level of engagement with children and families
- Assess the impact of policies or practices intended to improve case continuity
- Support Continuous Quality Improvement (CQI) initiatives focused on reducing variability in continuity
Continuity metrics depend on having data about case duration, key case events, and an understanding of the policy and practice related to the type of continuum service provided.
Critical to this is the ability to understand which workers were assigned to a case and when. Case continuity measures are a relatively new thing, and their use in child welfare management as indicators is still rare and perhaps limited to a few studies. Thus, there are no standard or common metrics for case continuity. That said, there is some evidence that increased continuity is associated with improved outcomes.
Example metrics:
- Average number of workers assigned per month
- Average largest percent of duration with an assigned worker
- Average percent of duration covered by first or last worker assigned
The figure below illustrates one measure of case continuity. The idea is that across the entire period of time the service is provided, if one worker is assigned, the level of continuity is 100%. If more than one worker is assigned, the metric is reduced proportional to duration by the amount of time the worker with the longest assignment is assigned.
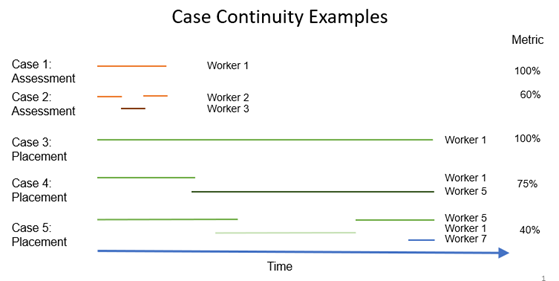
For CPS assessments with short duration (typically less than 30–45 days), continuity may be a minor concern. That said, some disruptions can occur.
For placement cases with longer durations (median durations of 9–12 months), continuity is a major concern. Over these types of time spans, there are many potential opportunities and reasons for lower continuity. Knowledge of policy and practice can also inform us about desirable and undesirable loss of continuity.
Worker- and Unit-Level Variability Metrics
This type of metric is a little more complicated to explain, thought the concept is pretty straightforward. The notion is that a worker or a group of workers (supervisory unit) acquires certain “characteristics” over time as they experience work with children and families. These “characteristics” will be different because the experiences are different. We would expect the experiences of a worker in the Bronx to be different in some ways compared to a worker from rural Colorado.
Worker- and unit-level variability metrics can help to
- Identify where (regions, offices, supervisory units) there are potential gaps in applying a range of agency policy
- Highlight possible explanations for variability that may be systematic and amenable to change
- Support continuous quality improvement (CQI) initiatives focused on reducing variability in practice and policy
Worker- and unit-level variability metrics depend on
- The characteristics of the children and families that are served
- The likelihood on average that a decision (e.g., removal) will occur
- Worker assignment data
- The amount of time we can accumulate information about the range of cases a worker or supervisory unit serve
The last point is important because over time the characteristics and decisions for a worker or unit become more stable, and any changes we observe (possibly because of a change in policy or practice) are less subject to small sample biases.
Example metrics:
- Average age of children served
- Average risk level of children served
- Proportion of assessments with an open case
- Proportion of African American children removed compared to white children
The histogram below shows the distribution of nine workers with varying proportions of decisions to open a case for ongoing services.
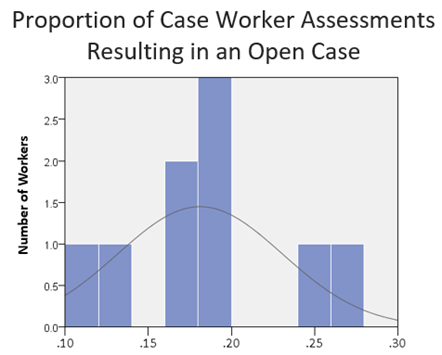
Proportion of Cases Opened
Of the 9 workers, 2 have opened a case less than 15% of the time, 5 have opened a case 15% to 20% of the time, and 2 have opened a case 20% to 30% of the time.
Level of Analysis
If assembled well, all three types of the metrics can be segmented by organizational levels and over time. The ingredient of time is critical because these sorts of metrics can play important roles in quality improvement process analysis where the usual goal is to reduce variability in performance over time.
Examples of levels of analysis for child welfare workforce metrics:
- Average Caseload by Supervisory Unit
- Average Worker Placement Proportion by Office
- Change in Worker’s Average Case Risk Level Over Time
Important Methodological Concept: Position vs. Person
The concepts of persons and positions in relation to cases is fundamental to being able to implement the methods needed to produce the sort of metrics presented here. This concept is also important as we consider how metrics obtained from HR data might be related to child welfare outcomes.
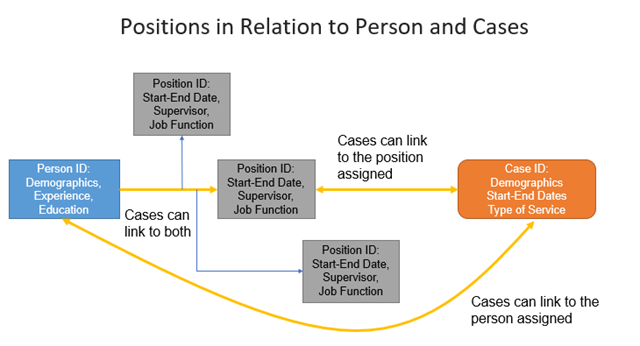
For example, if we are interested in metrics associated with supervisory unit-level variability, we need to link cases to units, and for that we need to know what position in the agency the worker occupied. If we are interested in case continuity, we are most likely concerned with who was assigned to the case.
Ideally, the child welfare information system will allow us to identify both the assigned person and assigned position. Knowing what the system can produce is critical to understanding the range of valid metrics that can be produced.
Conclusion
In general, the type of metrics just discussed can be used to help understand how agencies can improve outcomes. Ideally, testing to see if and how these metrics might help explain the variability in child welfare outcomes would be one of their primary uses. However, these metrics can also be used to help set HR-related performance targets, with caseload targets being the most common example.
1 Option One – Aggregate Estimate![]()
AACCt = Aggregate Average Caseload per Worker at time t
ACupt = Number of Active Cases (u = children, families) of type (p = intake, assessment, ongoing, etc.) on (t = date)
Wpt = Number of Workers Providing p at t.
2 Option Two – Disaggregated Estimate![]()
ACCt = Average Number of Active Cases per Worker at time t.
ACuwt = Number of Active Cases (u – children, families) assigned to worker (w) on (t=date). Wt = Assigned Workers at t
For more information on this topic, read our blog post.