Worker Turnover is a Persistent Child Welfare Challenge - So is Measuring It
Authors: Megan Paul, PhD, Courtney Harrison, MPA, Jonathan Litt, JD/MSW, and Michelle Graef, PhD
Turnover and other workforce challenges for child welfare professionals have been the subject of attention for many years. Consider this statement from a study published by the Children’s Bureau in 1960, “Turnover of staff in social agencies has been a serious concern of agency administrators for at least the past 10 years. Repeatedly, at conferences and in the professional journals, the complaint has been heard that staff turnover (1) handicaps the agency in its efforts to provide effective social services for clients; (2) is costly and unproductively time consuming; and (3) is responsible for the weary cycle of recruitment-employment-orientation-production-resignation …” (Tollen, 1960). That report included an unprecedented examination of turnover in child welfare, and they were able to determine that the average overall turnover rate for caseworkers in public child welfare was 36%, and the rate for resignations alone was 24%.
 Two of the biggest and most well-known efforts to gather national child welfare turnover more recently were in 2000 and 2004, when the American Public Human Services Association (APHSA) collected turnover rates (defined as leaving the agency) from 19 and 17 agencies, respectively. In 2000, the average turnover of child welfare workers in general was approximately 20%. In 2003, the average turnover rates were 22% for child protective service workers, 15% for in-home protective service workers, 18% for foster care and adoption workers, and 20% for workers that served in multiple roles. More recently, estimates of child welfare turnover rates for 2004–2015 were calculated using National Child Abuse and Neglect Data System (NCANDS) data for 49 jurisdictions (Edwards & Wildeman, 2018). They examined worker continuity from year to year by looking at changes in annually reported employee identifiers and reported median turnover rates. The following observations can be made from their findings:
- The median annual turnover (defined as leaving the job for any reason, including promotion) rate for frontline caseworkers across all years was 22%.
- The median rate varied only minimally across the years; the lowest median rate was 17% (in 2004) and the highest median rate was 25% (in both 2007 and 2015).
- Across the 12 years, turnover rates varied significantly within states and across states in a given year.
- For 2015, the most recent year for which they reported results, the median turnover rate was 25%.
Further details about each state for every year can be seen in this visualization.
In 2017 we invited public child welfare agencies to address turnover by applying to be a QIC-WD site. There were 25 applicants, representing a mix of counties, states, tribes, and territories. Turnover rates among applicant agencies varied from a low of 10% to a high of approximately 35%. Although this is a limited sample, it represents a variety of agencies and highlights the ongoing challenge of turnover.
Now, two years into the COVID-19 pandemic, anecdotal reports are that turnover and recruitment challenges are escalating even further than in past years, but there are no recent national data in child welfare to ascertain the extent of the problem. National data on turnover in general are available from the U.S. Bureau of Labor Statistics, and though recent data show that quit rates in 2021 across all jobs are hitting record highs, quit rates for state and local government (non-education) jobs do not markedly differ from those of the last several years. In this sector, annual quit rates from the last five years (2016–2020) average around 10.2%, and annual overall turnover (for any reason) is around 20.3%, with minimal variability in both metrics across the five years. The 2021 monthly quit rates and turnover rates are slightly higher for some months than in previous years, with the annual rate on track to be approximately two percentage points higher than the last several years (based on available data in January 2022). Exactly how child welfare turnover rates compare to those, however, is unknown.
This QIC-Take presents some of our observations about the ongoing challenge of turnover and how it is measured. Child welfare agency leaders and their Human Resource (HR) counterparts have expressed a desire to accurately measure turnover and better understand how to improve worker retention.
We worked directly with eight sites to dive into their data and gather additional information from staff to better understand some of the root causes of turnover. In addition, we hosted a Child Welfare Data Analytics Institute in 2021 to help more agencies use their data to answer important workforce questions. This QIC-Take shares what we’re seeing based on our work in the field, across a variety of jurisdictions, to help public child welfare agencies collect and analyze data so they can address child welfare worker turnover.
What We’re Seeing
One of the biggest challenges with quickly gathering national turnover rates is the availability of data and differences in how jurisdictions calculate turnover. Of the agencies that took the time to respond to the APHSA surveys (and were therefore motivated to share their information), only about 43% provided turnover data. Similarly, among our site applicants not all agencies could provide a turnover rate. This suggests challenges with being able to report even basic information—in this case, the number of authorized positions on a given date and the number of staff that left the agency for any reason in a one-year period. APHSA’s survey findings have thus served as benchmarks for the field because these data are difficult to gather, process, and compare. And though the absence of national data can create important limitations, what is more important at the agency level is that when turnover cannot be measured, it cannot be well understood and addressed.
Getting to an aggregate turnover rate of any sort starts with tracking individual employee movement. From a broader, organizational perspective, turnover typically refers to an employee leaving an organization altogether. This is often how child welfare agencies define turnover, though some define it even more broadly, as leaving state or county government. In either case, this type of separation is referred to as external turnover. Depending on the size of the agency (and how much room there is to move within it), this may underrepresent important movement. To better understand and address turnover among frontline workers, finer distinctions are helpful.
The most narrow definition of leaving is to leave a position but not a job. This typically involves transferring to another office to do the same work. In some agencies, this type of movement can be quite common, and though it constitutes retention on the one hand, depending on the type of work, it can still result in disruptions for children and families, coworkers, and supervisors. The next type of movement is leaving a job and taking another job in the organization. This can involve staying well connected to the work, even possibly retaining the same cases, such as when a worker is promoted to the next level in a career ladder. Or it can involve moving to a very different kind of job either within or outside of child welfare but still within the agency. Again, the opportunity for this kind of movement depends on the size and scope of the agency; it seems likely that large agencies with many divisions and jobs could have lower external turnover rates among child welfare workers because there is more room for intra-agency mobility. All of these types of turnover are considered internal turnover.
Beyond these basic distinctions, there are three other common ways of defining turnover. One common distinction is between voluntary and involuntary turnover (e.g., Mobley et al., 1979). Voluntary turnover is initiated by the employee, and involuntary turnover is initiated by the agency (e.g., dismissals, layoffs). A second distinction is between functional and dysfunctional turnover (Dalton et al., 1981). Functional turnover is considered beneficial to the organization, and dysfunctional turnover is detrimental to the organization. Functionality is defined in terms of employee performance; departure of poor performers is considered functional, and departure of high performers is dysfunctional. Finally, a third common distinction is between avoidable and unavoidable turnover; this refers to whether the turnover could have been prevented by the agency (Abelson, 1987).
 To create metrics around these different types of turnover, agencies need to know key factors about each employee departure—where the employee went, their reasons for leaving, and their performance levels. Agencies vary widely in the number and types of data they record around reasons for leaving. Records of separation reasons may not be systematically tracked at all, or they can involve a standard set of categories (anywhere from a few categories to over two dozen). Though they often have sufficient information to calculate voluntary and involuntary turnover, many agencies would find it challenging to examine other types. Performance data are often very limited, and estimations of avoidability often involve either guessing or focusing on only a few reasons that are clearly outside the agency’s control (e.g., medical issues, death, spouse moving), which is not very enlightening.
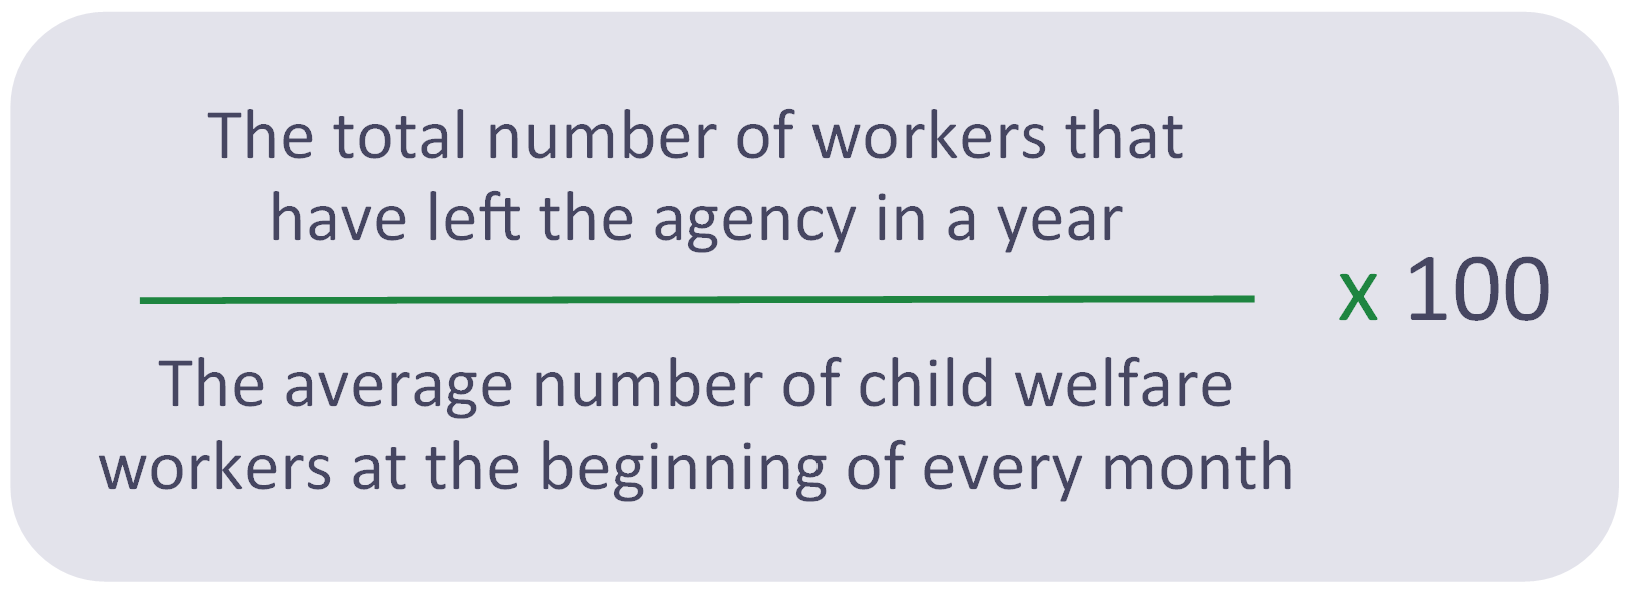
Aggregate turnover rates are calculated by dividing the number of people who have left (based on a chosen definition of leaving) by the total number of employees and then multiplying by 100 to get a rate. The number of employees is typically known as headcount, and it is best to use an average headcount across time (vs. the count on a single day) to account for fluctuations. For example, the following equation is one that could be used to arrive at an annual external turnover rate for frontline child welfare workers:
Turnover is not going away in a high stress work environment like child welfare, but child welfare agencies can work to understand their data and more accurately measure and address turnover. Additional information on voluntary (vs. involuntary) turnover, functional (vs. dysfunctional) turnover, worker performance, and reasons for leaving can help jurisdictions make informed decisions about hiring, training, and supporting the workforce.
Looking Ahead
Based on the data and our experience working with sites to understand turnover, the QIC-WD has the following recommendations:
- Keep records of employee movement and the reasons for the movement. Standardize the codes and categories and ensure that these are being used consistently and accurately. Create a codebook with clear definitions and ensure that all users are well versed in their applicability to different situations.
- For every movement out of the job, gather performance information about the individual. This can be as simple as asking the supervisor to provide a few ratings, such as overall performance and whether they would rehire the person (e.g., Dalton et al., 1981). Use these data to examine turnover functionality.
- If there is a high volume of functional turnover (many poor performers either being terminated or voluntarily leaving), explore the potential underlying reasons for poor performance (e.g., hiring, training, performance expectations, performance management).
 To determine turnover avoidability, use confidential exit surveys or interviews (by neutral interviewers) to ask employees if they believe there is anything the agency could have done to prevent them from leaving and, if so, what those things are. If there are highly unreasonable suggestions, that movement can be categorized as unavoidable, but the rest should be considered avoidable and worthy of further exploration.
- For turnover among child welfare workers, consider focusing on an additional type of turnover—movement that impacts children and families. All employee movement creates disruption of some sort, but the focus here is on movement that creates discontinuity for children and families. The extent of this depends on the type of work the person was doing, the type of work they will start doing, and whether and how cases are transferred. Because this will likely depend on a number of factors that could vary widely at the local level, this may be best assessed by having the assigned supervisor answer a simple question or two about this for every employee movement.
- In addition to trying to reduce the incidence of turnover, focus on ameliorating the impact. For example, to reduce the disruption to children and families, a teaming approach could ensure the continuity of at least one other worker. To reduce the impact on work teams, the agency could create a pool of trained workers ready to fill vacancies as soon as they arise.
 Be thoughtful and intentional about calculating turnover rates. Consider what type of leaving is important to understand. Always report how a turnover rate was calculated and the time span it covers, and don’t interpret a rate without knowing this same information. For further details on how to calculate various types of turnover, see the QIC-WD’s compilation of workforce metrics, which include headcount and turnover.
 - To compare turnover rates (within or across agencies), be sure that they are calculated in the same way. States with county-administered child welfare systems could create standardized measures of turnover. The Children’s Bureau could also create standards so that turnover, and other workforce metrics, can be compared across jurisdictions. Understand, however, that there are many local factors, many of which are outside agencies’ control (e.g., job market, labor market) that could influence turnover rates, so using other agencies as a benchmark is often inappropriate.
- To better understand turnover patterns and potential causes, look for variations in turnover through segmentation, which involves drilling down and looking at turnover rates for various subgroups. For example, voluntary turnover could be examined by recruiting source, employee demographics (e.g., race and ethnicity, previous work experience), geography, tenure, or supervisor. When rates are particularly high or low for a certain segment, explore potential reasons for this variability.
- Identify the root causes of turnover because it is a complex agency challenge related to a variety of factors. In our work with a diverse group of agencies, we identified multiple challenges related to turnover from hiring and onboarding practices, the need to address supervision and work-related traumatic stress, organizational culture and climate, and job design.
- Test interventions designed to address turnover. Too often agencies try one strategy and then try another, and another, and maybe even one more. This can cause initiative fatigue and workers may disregard the intervention as only a short-term strategy (a.k.a. “flavor of the month”). Most importantly, without an evaluation in place, there are no intervention-specific data to understand if it “worked.” The turnover data and metrics used to identify and investigate a problem should also be used to assess whether a workforce strategy actually makes an impact on turnover. Of equal or greater importance here is taking steps to create a situation where cause-and-effect conclusions can be made about the impact of the workforce intervention. The most powerful way to do this is to have a control group that does not participate in the intervention. Thus, instead of rolling out new initiatives across the entire workforce, only try them with a portion of the target group, and then compare the outcomes of the two groups.
- Remember that job performance is a critical workforce outcome, and it often gets neglected because of all the focus on turnover. Workforce challenges are often distilled into “recruitment and retention” issues. This shorthand phrase speaks only to getting and keeping employees, not to how employees can be most effective during their tenure. Although there are efforts to equip staff with the necessary knowledge and skills (typically through training), there is less attention to measuring and assessing individual performance. Common efforts include compliance monitoring (e.g., reporting whether key tasks are completed within required time frames) and annual performance reviews, which are often perfunctory and not used for any other purpose. Rethinking how performance is measured can create opportunities for managing it better and for using it to gauge the success of many workforce improvement efforts. For further information on performance metrics, see the QIC-WD compilation of workforce metrics and suggestions for using child welfare administrative data to capture performance information.
- For many of the steps above, be sure to capitalize on previous research, both in and outside of child welfare, to drive decisions and actions—what data to collect, what analyses to perform, and what interventions to employ. To guide practitioners and researchers, the QIC-WD is summarizing the most well-established and pertinent findings from the workforce literature. Using agency data and research literature are two key strategies for engaging in evidence-based management, which agencies should strive to do.
- Build or strengthen the partnership between Child Welfare and Human Resources by creating a workforce analytics team involving representatives from both groups and developing an action plan to use workforce and child welfare data to drive workforce improvement efforts.
The QIC-WD team has spent five years working with public child welfare agencies to implement and study efforts to address turnover, and data about the impact of those efforts are forthcoming. In addition, our work with agencies has affirmed the need to standardize how turnover is measured (both within an agency and across jurisdictions) and the value of examining different types of turnover. The challenge of turnover in child welfare is not new, nor is the desire to decrease it, but we have compiled and developed strategies that we believe can help the field improve how turnover is measured, which is the critical first step in any attempt to address it.