Data Segmentation
Data segmentation is the process of breaking down “big” data into smaller, more meaningful groups, called segments. In the case of workforce data, each segment represents a group of people with similar characteristics, either that pertain to them as an individual (e.g., gender, race, educational background) or to their connection to the organization (e.g., their job title, supervisor, or work schedule).
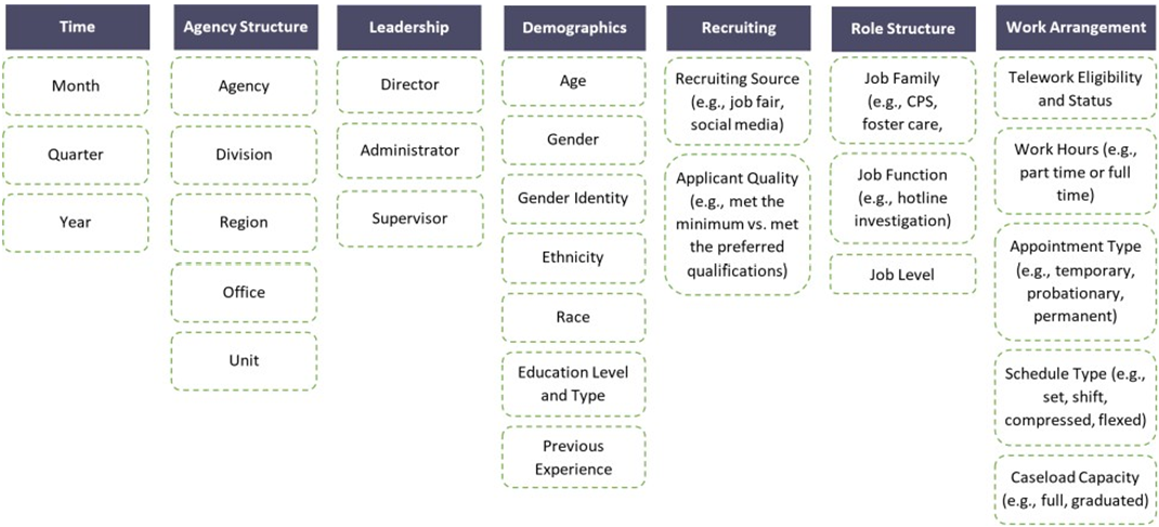
There are a variety of ways to “slice and dice” your data into meaningful groups. Some possibilities are listed below. The squares represent the unit of categorization (e.g., agency structure), and dashed green squares represent the data segments (e.g., region).
Data for a given workforce metric can be examined within segments (e.g., turnover within a specific agency office) or compared across segments (e.g., differences in turnover across different agency offices). Segmentation is a powerful means of drilling down in your data to pinpoint areas of strength and opportunity, identify underlying outliers or patterns, explore root causes of workforce issues, and employ workforce efforts more strategically and efficiently.
In this 7-minute video, Maggie Thompson, QIC-WD Workforce Specialist, provides examples of data segmentation.
See Data Segmentation for further advice on drilling down into your workforce data.
The content contained in this blog post was developed as part of the QIC-WD’s Child Welfare Workforce Analytics Institute. The Institute was designed to facilitate growth and collaboration between leaders in child welfare and human resources in their awareness, knowledge, and use of data analytics.