Measuring Diversity, Equity, and Inclusion
What is Diversity?
Diversity refers to the degree of differences in the composition of the workforce in terms of such constructs as race, ethnicity, gender, gender identity and expression, sexual orientation, religion, disability, age, national origin, language, or other social identities. Though there are certainly other types of employee differences worth assessing (e.g., acquired diversity characteristics, such as education, skills, personality, preferences, attitudes), the focus here is on inherent social identities, especially those that are related to differences in representation, power, and privilege. Note that diversity is a characteristic of a group, not an individual.
How is Diversity Measured?
To measure the diversity of an agency’s workforce, data must first be collected from employees on the variables of interest (e.g., race, ethnicity gender, age). In designing the questions, it is important to consider the language, suitability, and fit of the questions and the response options. For guidance on inclusive language, see the guidelines from the American Psychological Association. Also be sure to include response options that match employees’ self-descriptions. For example, limit or avoid the need for an Other option, and allow people to select more than one option when relevant. If an exhaustive list of options isn’t possible, consider alternative labels such as Another race. When questions or answers don’t reflect employees’ identities, respondents can be left feeling excluded, which is counter to the purpose of diversity, equity, and inclusion (DEI) efforts. Getting employee input on the questions and answers may be a way to avoid missteps and build buy-in. For the purpose of comparing agency data with local population and labor force data, consider asking questions that align with the questions used to collect those comparison data. For example, to compare with federal estimates of workforce characteristics, it is best to use the US Census Bureau’s demographics questions or to ask questions in a way that allows for appropriate comparisons to those data. Finally, any decisions about what data to collect should be made with knowledge of any regulations that either require or limit the collection and use of diversity data.
All diversity data should be gathered via voluntary self-report. For the purpose of analysis, it is best if these data can be tied to individuals and stored in a human resource management system (HRMS) so they can be connected to other personnel and agency data. This will increase the utility of the data, but if there are significant barriers to doing this, they can instead be collected anonymously via surveys. The latter approach puts limitations on analyses but is still better than not having the information at all. On the plus side, employees may feel more comfortable sharing this kind of information anonymously, so the data may be more complete and accurate. A hybrid approach can also be used to maximize the availability of information. If data are stored in an HRMS, it is important to ensure that employees occasionally review and update them. Even though many answers may not change over time, employees may change what information they are willing to share since they were first hired. In all cases, it is important to communicate the purpose of collecting the information, where it will be stored, how it will and will not be used, and assurance that the data will be confidential and secure.
The simplest way to analyze diversity data is to calculate the number and percentage of employees in a given identity category (e.g., 72% female). More advanced analyses can explore intersectionality—how multiple identities combine to create additional groups (e.g., combine race and gender)—in order to provide further insights into workforce diversity. In addition to exploring diversity overall, data should be segmented, or disaggregated, by other relevant variables such as job class or geography to understand important variations withing the agency. For example, diversity tends to diminish at higher levels of organizations, and knowing the extent of this can inform recruitment, hiring, promotion, and retention strategies at different levels.
Knowing an agency’s workforce composition can be very useful on its own, but it is also important to know if it is sufficiently diverse. One common way of answering this question is to assess the extent to which the workforce matches the local labor pool; the agency workforce should reflect the diversity of the available talent pool that meets hiring qualifications. Exact information about the relevant current labor pool may not be available but some general estimates are available from federal and local sources. For example, federal Equal Employment Opportunity data provide workforce availability estimates based on geography, education, occupation, age, sex, race, and ethnicity. Comparing agency workforce data with the workforce availability estimates (known as utilization analysis) can reveal potential shortfalls, which can again inform recruitment, hiring, promotion, and retention strategies. Keep in mind that attempts to address underrepresentation or increase diversity must not involve giving preferential treatment based on factors such as race and gender. Instead, the goal is to ensure that employment practices are fair and to remove barriers so that everyone has equal access and opportunity.
What is Equity?
Equity refers to the degree of fairness in treatment, access, opportunity, and outcomes for all employees, with particular attention to those that are members of protected groups. Federal laws prohibit employment discrimination on the basis of race, color, religion, sex (including pregnancy, gender identity, and sexual orientation), national origin, disability, age (age 40 or older), or genetic information. Additional regulations may exist at the state, county, or city level. Equity is relevant to all stages and aspects of employment, such as job postings, recruitment strategies, applications, hiring standards and processes, work schedules, training or other professional development opportunities, performance evaluations, disciplinary actions, compensation and benefits, leave, transfers, promotions, job assignments, working conditions, and terminations.
How is Equity Measured?
Two broad categories of data are relevant for measuring equity. The first category includes information about what agencies think and do, and the second category is what employees or prospective employees (i.e., applicants) think and do.
Agency
Equity-related agency information includes a) general employment policies and practices and b) treatment of and decisions about applicants or employees, either individually or as subgroups. For example, consider the hiring process. General policies and practices around hiring involve, among other things, minimum qualifications, screening processes, interview questions, scoring procedures, who is involved implementing the hiring process, and what training they receive to do so. Agency decisions about applicants include decisions about whether a person is invited to advance at each stage of the hiring process and how they are treated throughout the process.
Equity in Policies and Practices
The process of assessing equity in policies and practices does not typically involve much in the way of hard numbers. Instead, it involves a systematic review of policies and practices, with an eye toward potential inequities. Thus, this process may not seem like measurement in the more conventional sense. It is nonetheless one important way of exploring whether and how equity is formalized. The most objective insights will likely be gained by having DEI experts involved in this review. Ways to gather employee feedback are described later in this resource.
Equity in Decisions About Applicants or Employees
Assessing equity in personnel decision making involves data from the full array of employment decisions (e.g., hiring, work schedules, training, performance evaluations, disciplinary actions, compensation and benefits, promotions, and terminations). For agencies with more advanced data collection and storage, most of the relevant data are likely available in the agency’s HRMS. Otherwise, data may reside in other digital or paper files. If important data are not systematically recorded, agencies may want to aim to start doing so.
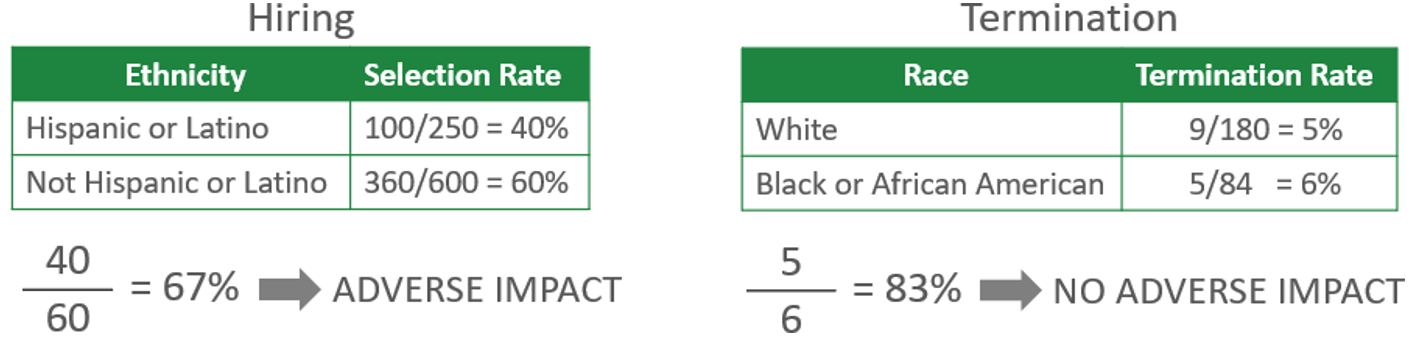
Workforce metrics associated with personnel decisions (e.g., hiring rate, promotion rate, termination rate) can be calculated for each group of interest and then compared to see if there are significant differences. A standard threshold for determining whether differences are too large (i.e., inequity is present) is called the four-fifths rule. For a positive event (e.g., hiring, promotion), if the selection rate for a focal group is less than 80 percent that of the group with the highest selection rate, there is adverse impact on the focal group. Conversely, for negative events (e.g., discipline, termination), if the lowest rate is less than 80% that of a focal group, there is adverse impact on the focal group. Though adverse impact may not be the result of intentional discrimination, it can result in legal liability and should be remedied unless there is a legitimate business justification. See the simplified examples below.
Applicants and Employees
Equity-related information about applicants and employees include their a) perceptions and b) behaviors.
Perceptions
Through surveys, applicants and employees can be asked to share perceptions of fairness around agency policies, practices, and treatment. These surveys should include questions about group identity variables of interest (e.g., race, ethnicity, gender, gender identity, sexual orientation) so the results can be segmented to look for group differences. Several categories of perceptions and measures are described below.
- Applicants: Perceptions of the fairness of the hiring process (e.g., Ababneh et al., 2014; Truxillo et al., 2002).
- Employees: Perceptions of the fairness of personnel policies, practices, and decisions. Agencies can write items that are tailored to their specific policies and practices or use or adapt existing measures such as the Organizational Fairness factor of the Diversity Perceptions Scale (Mor Barak et al., 1998) or the Equitable Employment Practices factor of the Climate for Inclusion Scale (Nishii, 2013). Focus groups or employee review teams are also options for gathering feedback on policies and practices.
- Employees: Experiences of interpersonal treatment, such as interactional justice, incivility, ostracism, supervision, and organizational politics.
- Employees: General job attitudes such as engagement, job embeddedness, employee fit, coworker support, supervision, psychological safety, job satisfaction, perceived organizational support, organizational commitment, or intentions to leave.
If statistical analyses reveal significant group differences in any of the areas above, further information can be gathered through interviews or focus groups to better understand the associated dynamics and details behind the numbers and to explore how these differences can be eliminated.
Behaviors
Equity-related applicant and employee behaviors constitute a relatively small fraction of equity information but can nonetheless provide some valuable insights. Most data should be found in an agency’s applicant tracking system or HRMS and again, diversity characteristics are needed to compare groups. A few examples are below.
- Applicant dropout rate for each step of the hiring process
- Employees’ pursuit of various opportunities, such as internal application rates for promotions
- Voluntary turnover rates
- Rate of HR complaints, both in general and specific to discrimination or harassment
What is Inclusion?
Preferred definitions of inclusion have evolved over time. One approach refers to the degree to which employees feel respected, accepted, supported, and valued, regardless of their gender, race, ethnicity, age, disability, or other social identities. A slightly but meaningfully different approach defines inclusion as the behaviors (e.g., by employers, leaders, or coworkers) that lead to the feelings of being respected, accepted, etc. Using this latter definition, employees’ feelings of inclusion are sometimes called belonging instead of inclusion. Other definitions involve a combination of both behaviors and feelings.
How is Inclusion Measured?
As with measuring equity, measuring inclusion involves looking at 1) agency policies and practices and 2) employee perceptions.
Inclusiveness of Agency Policies and Practices
The process of assessing inclusiveness of agency policies and practices is the same as the process of examining them for equity. A systematic expert review of policies and practices can explore areas to expand inclusion. For example, inclusiveness of LGBTQ+ employees can be enhanced by using gender-inclusive language in policies and including sexual orientation and gender identity in non-discrimination policies. For guidance on creating disability-inclusive policies and practices, see this QIC-WD summary of resources.
Employee Perceptions of Inclusion
As with measuring equity-related perceptions, measuring perceptions of inclusion is typically done through surveys. Again, these surveys should include questions about group identity variables of interest (e.g., race, ethnicity, gender, gender identity, sexual orientation) so the results can be segmented to look for group differences. Potential measures include the Integration of Differences and the Inclusion in Decision Making factors of the Climate for Inclusion Scale (Nishii, 2013) and the Perceived Group Inclusion Scale (Jansen et al., 2014).
General Guidance
A few additional cautions are worth noting for analyzing, interpreting, and sharing DEI information. When using surveys and comparing group responses, keep in mind the risk of nonresponse bias, which means that people who responded may be different from those who did not respond. This is a general challenge with surveys, but it creates additional problems if groups differ in their survey completion rates; the people you most want to hear from may be the most hesitant to respond. The best approach is to make proactive efforts to encourage participation (e.g., ensuring confidentiality and possibly anonymity, sharing information about the purpose and use of the survey, keeping the survey short, offering protected time to complete it, sending reminders, and offering small incentives). After data have been collected, measuring nonresponse bias requires knowing the expected percentage of each group, which may or may not be available. If employee data are available in an HRMS, they can be used to determine the extent of nonresponse bias (e.g., if 10% of employees are American Indian or Alaska Native, the goal is to have approximately 10% of survey respondents be American Indian or Alaska Native).
When segmenting data by group identity variables, the number of responses for each group can become small, and small groups can create challenges for conducting and interpreting certain types of statistical analyses. An analyst will need to adjust accordingly (e.g., combining groups, using alternative statistics, or forgoing a specific analysis altogether). Likewise, when reporting results, if the number of people in a group is too small, individuals might be easily identified. For example, if survey results are broken down by office, race, and gender, and there is only one Black female in a given office, a report will reveal how that individual responded. A common anonymity threshold is 5 respondents. There will likely always be a challenge of balancing the need to explore and identify differences while protecting confidentiality.
The final piece of advice around measuring DEI data, especially through surveys or focus groups, is to honor employees’ input by acting on the data in some visible and meaningful way. Depending on the results, careful thought may be needed to make the best decision about 1) how, when, and with whom to share your findings and 2) how to respond to the findings. The key is to avoid leaving employees feeling like they invested in a process that went nowhere. After sharing results, be sure to continue the communication as action plans are put in place and progress is made. Doing so will strengthen employees’ trust and participation in the agency’s DEI efforts.